
How to extrapolate a limited data set?
Added on 12/08/2021
Each health economic analysis starts with clinical data. But if your sample does not provide mature data, how can you use this data as reliably as possible?
Each health economic analysis starts with clinical data. The trick is to reliably estimate the expected outcome using a limited dataset. In other words, if your sample (clinical study) does not provide mature data (interim data, small number of patients, large variance in results, …), how can you use this data as reliably as possible?
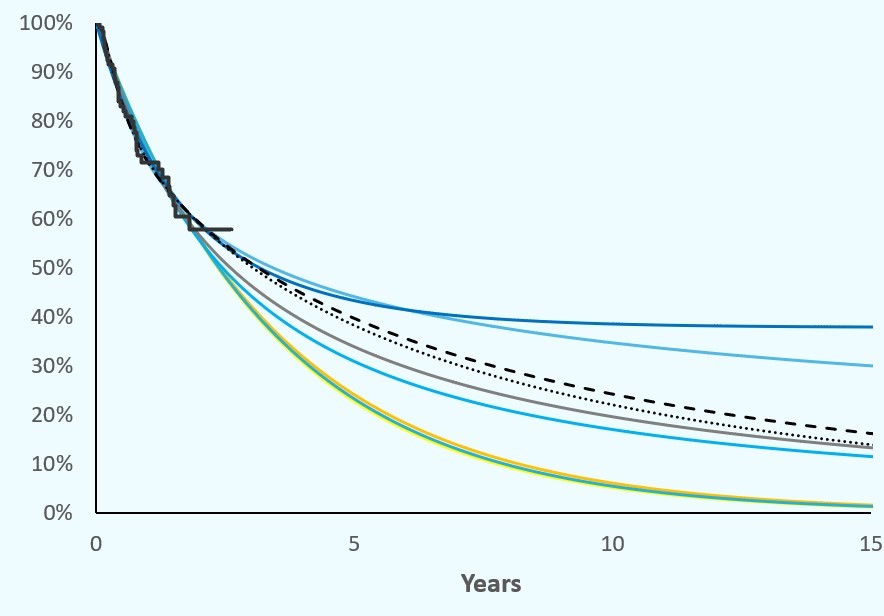
Suppose you have a dataset covering 6 months (your study is not yet final, but you still want to predict the long-term outcome). Let us assume that you would like to evaluate disease progression (progression-free survival). As soon as a limited number of the patients have already progressed, you can simulate the overall patient population, including the patients that have not yet progressed. To do this, you need to plot the data from the clinical trial in a graph, a so-called Kaplan-Meier curve. The X-axis simulates the time, the Y-axis a percentage. All patients start at ‘time = 0’ at 100 % (no progression). Over time, all patients will progress (or die) and thus the KM curve ends up at 0 %. The curve will not show a straight and proportional course. In addition, you will see that the points on the curve (your individual patient data (IPD)) are distributed relatively erratically. If all data points are connected to each other, you will see a step-wise decrease in your graph, where the depths and lengths of the ‘steps’ are always a bit different. If you simulate your KM curve, based on only some of the patients (because the rest of the patients have not yet progressed), then you need to simulate the rest of the stairs.
Of course, there is no point in simulating it in the form of a ‘staircase’. You will first need to simplify the existing scattered data points to a ‘best fit’ line that represents the average progression of your (sub)group. This ‘best fitting curve’ will statistically extend over time (parameterising) until all patients have progressed (at least, based on your simulation).
But how do you simulate something like that? Fortunately, there are statistical programs that can extrapolate an existing data set. The most well-known statistical techniques used are: Gompertz, Lognormal, Log Logistic, Weibull, … . Each of these techniques generates a slightly different expected course from the known dataset. The trick, of course, is to select the ‘best fitting’. There are also automated solutions for this. But statistics aren’t everything. We already encountered very nice graphs that however do not make sense in real life. An optical evaluation of all chart lines should be carried out, taking into account clinical practice expertise. Only then can you use the ‘best suitable extrapolated chart line’ for further analysis, but, as always, still with caution.
Sometimes we see imature interim data extrapolated after which the ‘fantastic’ results are sent out into the world … often based on assumptions. For example, it may be that a long-term treatment effect is ‘expected’ to occur, even after the early discontinuation of treatment. This ‘waning effect’ indeed may effectively occur in practice, but again, some caution is required. In addition, the assumption will not be valid for every patient. The effect within your average population should therefore be taken into account. In addition, the environment (your study) is often less controlled in a real-life setting. ‘Real-life’ registries often show over time that the ‘expectations’ are not so spectacular after all. Rarely does the opposite happen, that ‘real-life’ exceeds the study results.
And all that beauty should of course be put in perspective. To what do you compare? As mentioned in one of our previous blogs (‘Clinical data, the key to a good market access dossier’), you need to compare at least 2 datasets to be able to ‘claim’ that the innovation means added clinical value (e.g., less rapid progression). If you compare with placebo you may score an easy win, but once you replace the placebo-related data with the ‘best standard of care’, the picture often looks less rosy.
In concrete terms, a high price requested for an innovation should be balanced against the clinical study outcomes. Additional study data can strengthen confidence in your innovation. In any case, as a developer, think from your payor’s perspective and it’s needs. And assess the uncertainty associated with the clinical data and the market introduction of your innovation, and this in relation to the constantly evolving landscape.
Setting up a strategically sound market access strategy that takes this into consideration forms the foundations of your potential success.
If you have any questions after reading this blog, do not hesitate to contact us.
See you soon,
Your Hebias team